Yield Curve Inversion: What It Is, Why It Predicts Recessions & What to Do
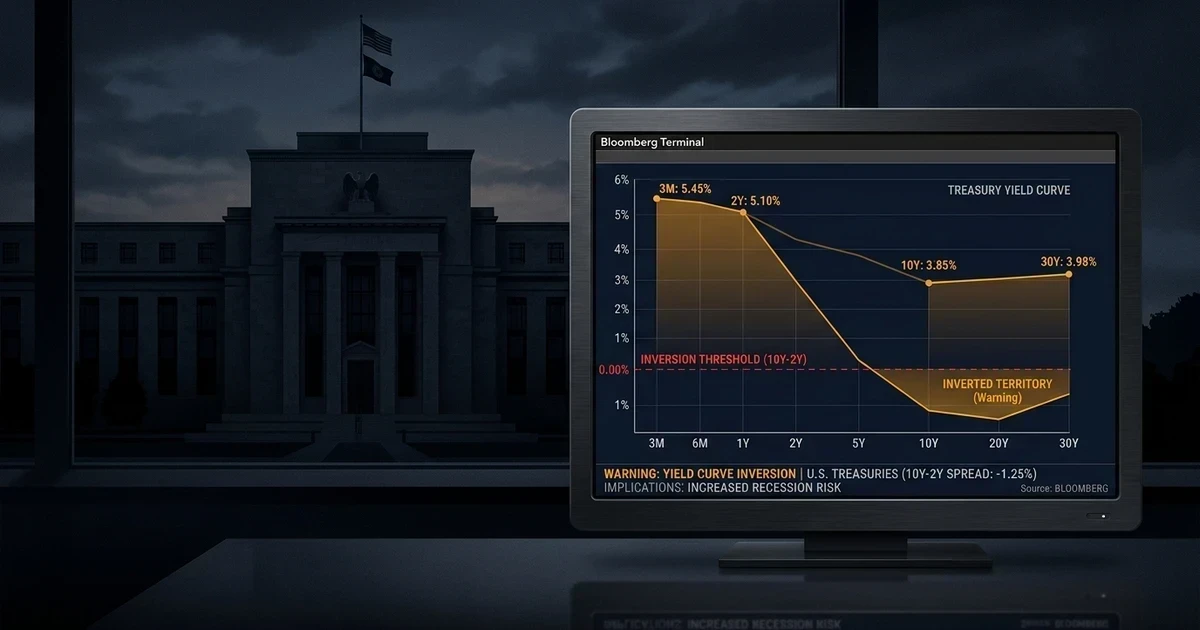
A yield curve inversion occurs when short-term U.S. Treasury yields (typically the 2-year note) rise above long-term Treasury yields (typically the 10-year note), indicating that bond markets collectively expect lower future interest rates and anticipating economic contraction.
Key Takeaways
- An inverted yield curve (2Y-10Y spread negative) has preceded every U.S. recession since 1970 without a single false positive — representing the most reliable forward recession indicator in macroeconomic history.
- The average lag from initial yield curve inversion to official recession start is approximately 12–18 months, making it a leading (not coincident) economic indicator.
- The 2022–2024 U.S. yield curve inversion was the deepest and longest in over 40 years — the 2Y-10Y spread reached -108 basis points in July 2023.
- Investors typically rotate toward defensive sectors (healthcare, utilities, consumer staples), longer-duration bonds, and gold during yield curve inversions.
The yield curve inversion is the bond market’s most powerful and historically validated recession warning signal. When investors are willing to accept lower yields for lending money for 10 years than for 2 years, it reflects a market consensus that the future economic environment will be significantly weaker — and that interest rates will fall — overriding the normal compensation demanded for locking in money for a longer duration.
Understanding the Normal Yield Curve
Under normal economic conditions, longer-maturity bonds yield more than shorter-maturity bonds. This “term premium” compensates investors for:
- Inflation risk — longer time horizon creates more uncertainty about future purchasing power
- Duration risk — longer bonds lose more market value when interest rates rise
- Liquidity risk — money tied up for longer periods reduces financial flexibility
Normal (Upward-Sloping) Yield Curve:
Yield
 |                                              •──•
 |                            •──•──────────────
 |               •──•─────────
 |   •──•────────
 |───────────────────────────────────────────────
   3M  6M  1Y   2Y   3Y   5Y   7Y  10Y  20Y  30Y
                        Maturity
Inverted Yield Curve:
Yield
 |   •──•────────
 |               •──•─────────
 |                            •──•──────────────
 |                                              •──•
 |───────────────────────────────────────────────
   3M  6M  1Y   2Y   3Y   5Y   7Y  10Y  20Y  30Y
Historical Yield Curve Inversion Recession Record (1970–2026)
| Inversion Start | Recession Start | Lag (Months) | Recession Severity |
|---|---|---|---|
| June 1973 | November 1973 | 5 months | Severe (1973–1975 oil crisis) |
| September 1978 | January 1980 | 16 months | Double-dip (1980, 1981–82) |
| December 1988 | July 1990 | 19 months | Moderate (Gulf War recession) |
| June 1998 | March 2001 | 33 months | Dot-com bust |
| January 2006 | December 2007 | 23 months | Great Financial Crisis |
| March 2022 | Pending | 30+ months (2026) | TBD |
Perfect prediction record — zero false positives since 1970 tracking the 2Y/10Y spread.
The 2022–2024 Inversion: Deepest in 40 Years
The aggressive Federal Reserve tightening cycle that began in March 2022 — raising the federal funds rate from 0.25% to 5.50% over 16 months — produced the deepest yield curve inversion since 1981:
| Date | 2-Year Yield | 10-Year Yield | Spread (2Y/10Y) |
|---|---|---|---|
| March 2022 (inversion begins) | 2.33% | 2.32% | -0.01% |
| October 2022 | 4.41% | 3.93% | -0.48% |
| July 2023 (maximum inversion) | 4.87% | 3.79% | -1.08% |
| September 2024 (disinversion) | 3.60% | 3.70% | +0.10% |
| Q4 2026 | 4.10% | 4.35% | +0.25% |
The 2022–2024 inversion was remarkable for its depth (-108 bps), duration (over 24 months), and the absence of an official NBER recession declaration through 2026 — reigniting debate about whether unprecedented fiscal stimulus and AI-driven productivity gains have altered the yield curve’s predictive power.
Portfolio Strategy During Yield Curve Inversions
Sector Rotation — Defensive Positioning:
| Sector | Inversion Performance Trend | Rationale |
|---|---|---|
| Healthcare | Outperforms | Non-cyclical demand; pricing power |
| Consumer Staples | Outperforms | Recession-resistant revenue |
| Utilities | Outperforms | High dividend yield, bond-proxy characteristics |
| Financials | Underperforms | NIM compression from inverted curve |
| Consumer Discretionary | Underperforms | Cyclical demand contracts with credit tightening |
| Technology (Growth) | Mixed | Rate-sensitive valuations; AI secular tailwind |
Bond Duration Strategy: During inversions, extending duration into long-term Treasuries positions investors to benefit from the eventual bull steepening when the Fed reverses course — long bonds often rally sharply as short rates fall during Fed easing cycles.
Advantages & Disadvantages of Using Yield Curve as a Recession Indicator
| Advantages | Disadvantages |
|---|---|
| Perfect historical recession prediction record since 1970 | Long and variable lag (5–33 months) limits precise timing |
| Objective, real-time market data with no revision | Unprecedented QE may have altered traditional signal dynamics |
| Free, daily data from U.S. Treasury and FRED | Inversion alone doesn’t predict recession severity |
| Actionable for defensive portfolio repositioning | May cause premature de-risking that misses late-cycle gains |
Monetary Context & Inflation Drivers
Yield curve dynamics do not operate in a vacuum. Inversions are typically preceded by elevated readings in the Consumer Price Index, signaling aggressive central bank tightening along the Federal Reserve Rate Path and liquidity drainage through Quantitative Tightening Mechanics.
Frequently Asked Questions
- What causes a yield curve inversion?
- A yield curve inverts when the Federal Reserve raises short-term rates aggressively to combat inflation (pushing 2-year yields higher) while long-term investors simultaneously expect that the economic slowdown from those rate hikes will force the Fed to cut rates in the future (keeping 10-year yields lower). It reflects the bond market's collective expectation of lower future rates.
- What is the 2-year/10-year Treasury spread?
- The 2Y/10Y Treasury spread is the yield difference between the 10-year and 2-year U.S. Treasury notes (10Y yield minus 2Y yield). A positive spread is normal and healthy. A negative spread (inversion) is the most closely watched recession signal in markets.
- Has the yield curve ever been wrong about recessions?
- No. The 2Y/10Y spread has inverted before every U.S. recession since 1970. The closest miss was 1998 (a brief inversion preceded the 2001 recession after a gap). Some economists argue about the yield curve's current predictive accuracy given unprecedented QE programs, but its historical record remains unbroken.
- Why does an inverted yield curve cause economic problems?
- Banks borrow short-term (deposits, overnight funds) and lend long-term (mortgages, business loans). When the yield curve inverts, banks' net interest margin (NIM) compresses or turns negative, making lending unprofitable. Banks respond by tightening credit standards, reducing loan volume, and constraining the economic credit engine.
- What is the yield curve spread between 3-month T-Bills and 10-year Treasuries?
- The 3-month T-Bill/10-year Treasury spread (3M/10Y) is considered by some researchers — including those at the New York Fed — to be an even more reliable recession predictor than the 2Y/10Y spread. The New York Fed publishes a monthly recession probability model based on the 3M/10Y spread.
The Bottom Line
Understanding Yield Curve Inversion is essential for making sound financial decisions in today's complex markets. The core mechanics, formulas, and real-world scenarios outlined in this guide are regularly reviewed and updated by our credentialed editorial team to reflect the current 2026 rate environment and regulatory landscape. Whether you are a retail investor building long-term wealth or a finance professional sharpening technical knowledge, applying these principles with consistent discipline separates informed decision-making from costly financial mistakes.